Flight Data Analysis
Note: This tutorial is applicable for all TAObotics Q series products.
What’s Behind Flight Crashes
It is definitely a nightmare for users to encounter a flight crash. We highly suggest a safe pilot be ready for each flight so that no people will get hurt. There can be many reasons that lead to a flight crash, both in hardware and software. In the hardeware level, users have to be certain that sensors are calibrated properly, properllers are mounted correctly, and the UAV platform is with a good mechanical condition. In this section, we will give an introduction on what we can find from the flight data log. Interested users can also refer to the official PX4 documentation in https://docs.px4.io/master/en/log/flight_log_analysis.html.
Flight Data Log
The flight data log (ulg format) is stored in the SD card within the TAObotics autopilot. It can be accessed either by directly using a SD card reader or from the Qgroundcontrol Station with a usb connection. The data log is automatically started from each arming by default although the setting can be changed, and each log is named by the flight time or a session ID.
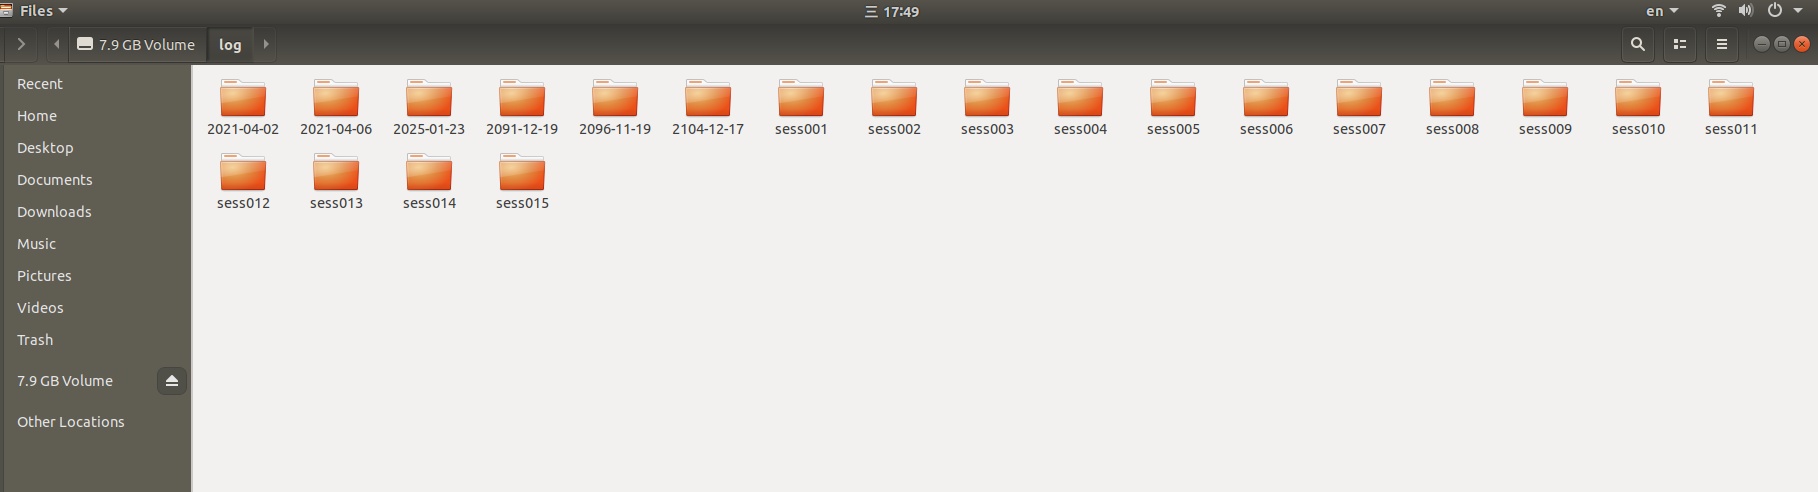
With a SD card reader, the data log can be found under the directory log, shown below:
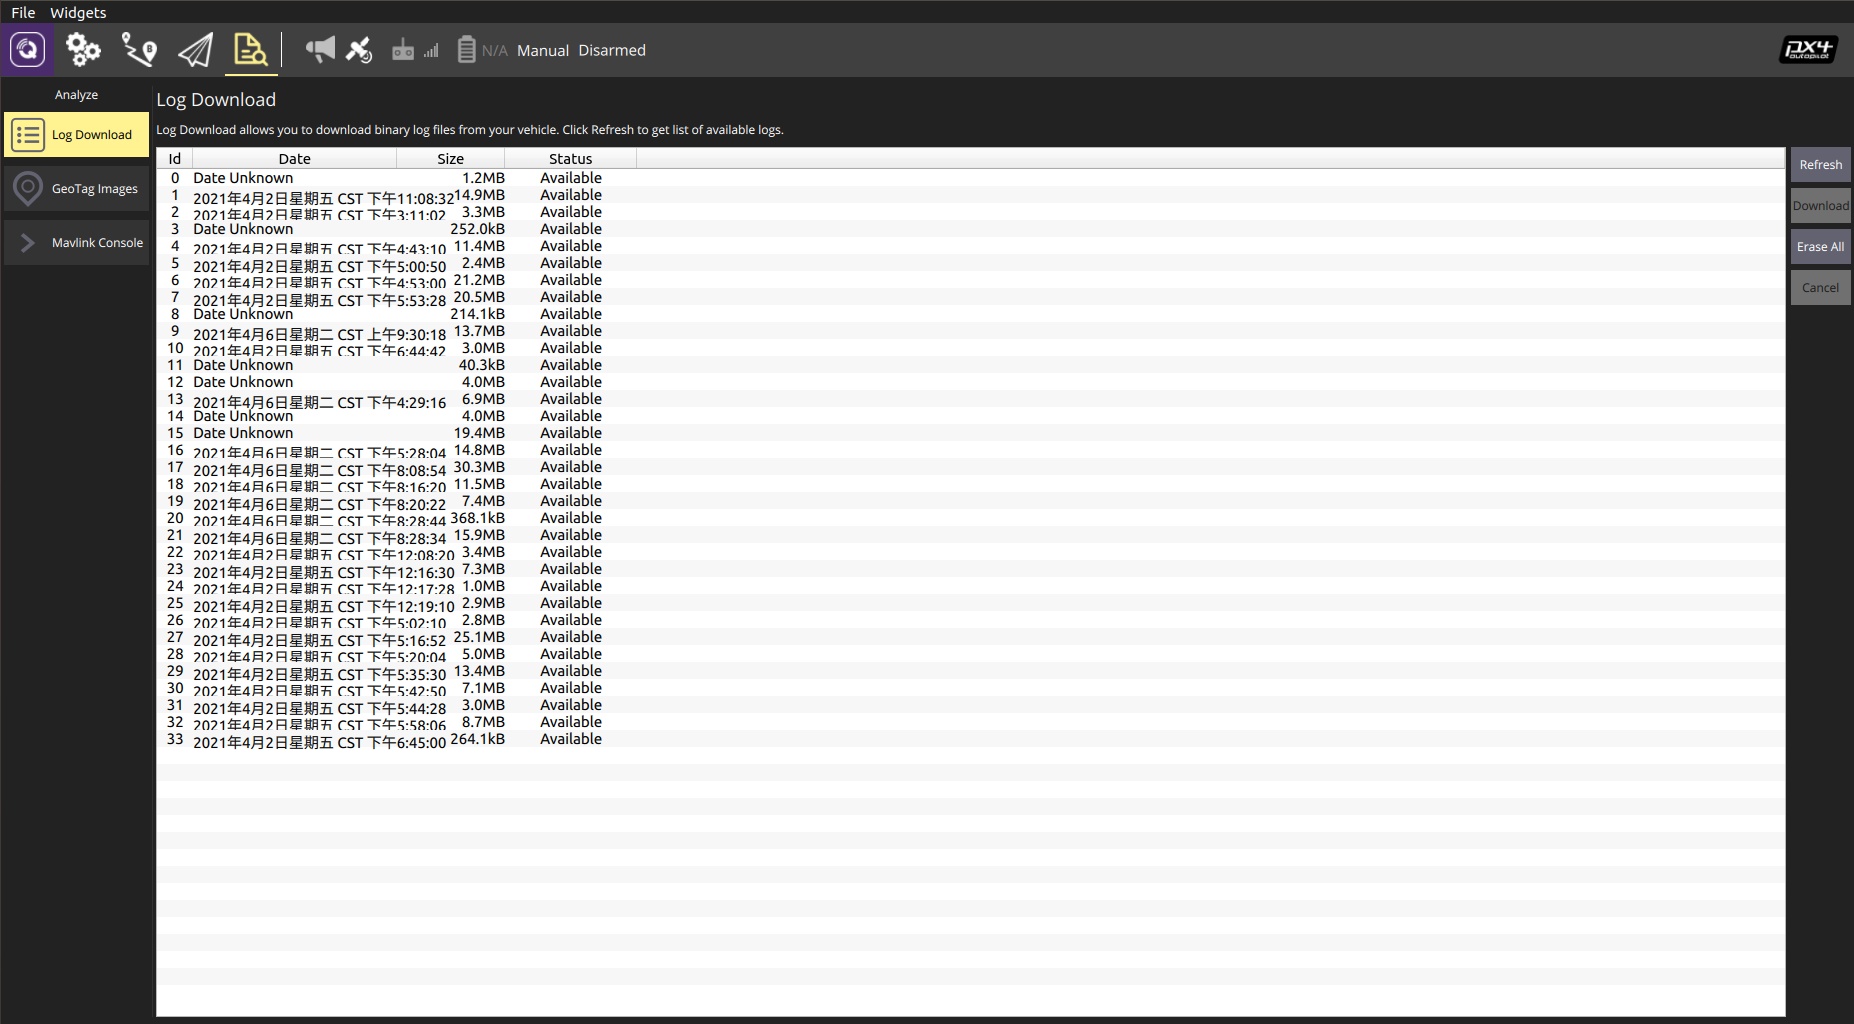
 From the Qgroundcontrol station, the data log can be viewed under the Analyze tag by clicking the refresh button, and these log is ordered by flight time. Note that the telemetry connection is not recommended here as the wireless transmission is quite slow.
Tools
The recommended tools needed for data analysis are listed below:
python 2 or 3 environment
pyulog python package
Matlab (version later than 2010 would be fine)
The python 2 or 3 environment has to be set up first in either Windows or Ubuntu. For Windows users, simple guides can be found in https://www.howtogeek.com/197947/how-to-install-python-on-windows/, and https://phoenixnap.com/kb/install-pip-windows. For Ubuntu users, the python environment is typically installed by default or can be set up easily with sudo apt commands.
The pyulog package can be either installed by the pip package manager or from source. The source is hosted in https://github.com/PX4/pyulog. The pip installation method is:
pip install pyulog
Data Visualization and Analysis
The data log has to be converted by the pyulog package to csv files first, with the command below. The command can be performed within the PowerShell or command prompt for Windows users.
ulog2csv <filename>.ulg
We provide our customers a convenient Matlab script, and it can be executed by simply changing the filename setting accordingly. The script will plot figures for attitude, velocity, position, navigation states, etc, and users can modify with their own interest.
To illustrate, an attitude tracking figure is shown below. The red and blue curves depict the reference and real data respectively. Flight crashes are usually caused by the attitude instability. Users can then track the crash time accurately by zooming into time intervals when the attitude control is invalid. From the given figure, the attitude tracking is satisfactory.
![]() The following position tracking figure can be analyzed with the same fashion. For normal waypoint flight missions, the position tracking performance matters quite a lot.
The following position tracking figure can be analyzed with the same fashion. For normal waypoint flight missions, the position tracking performance matters quite a lot.
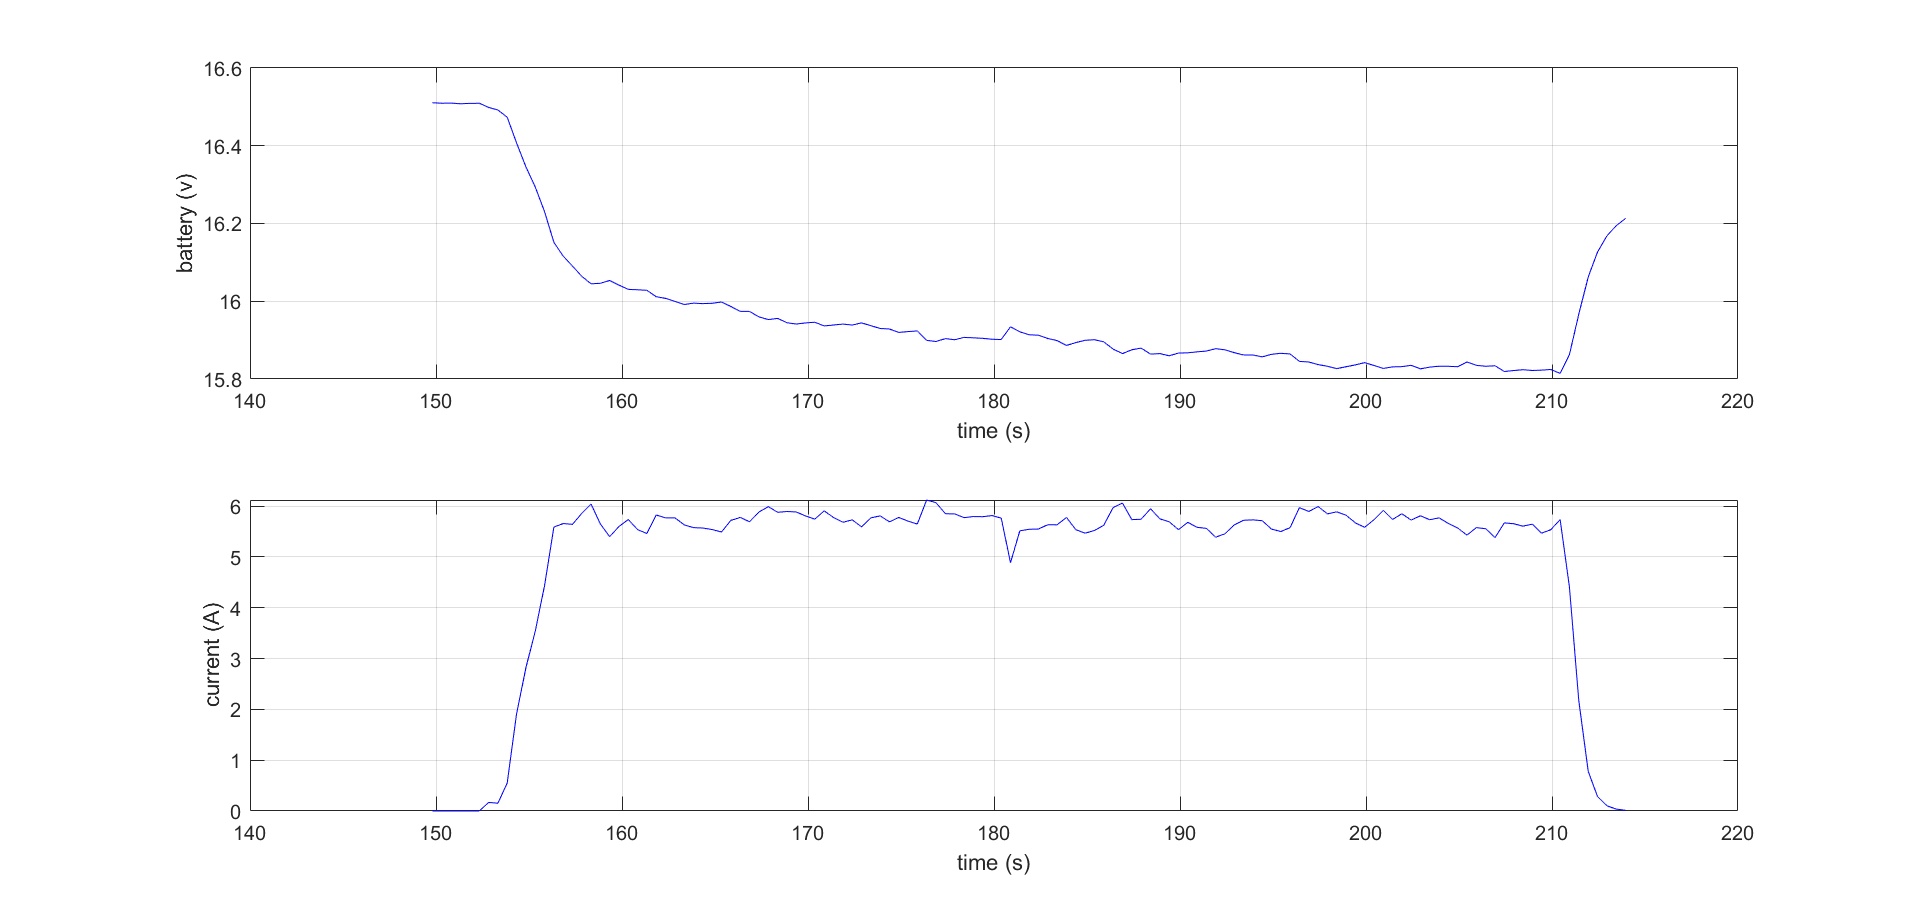
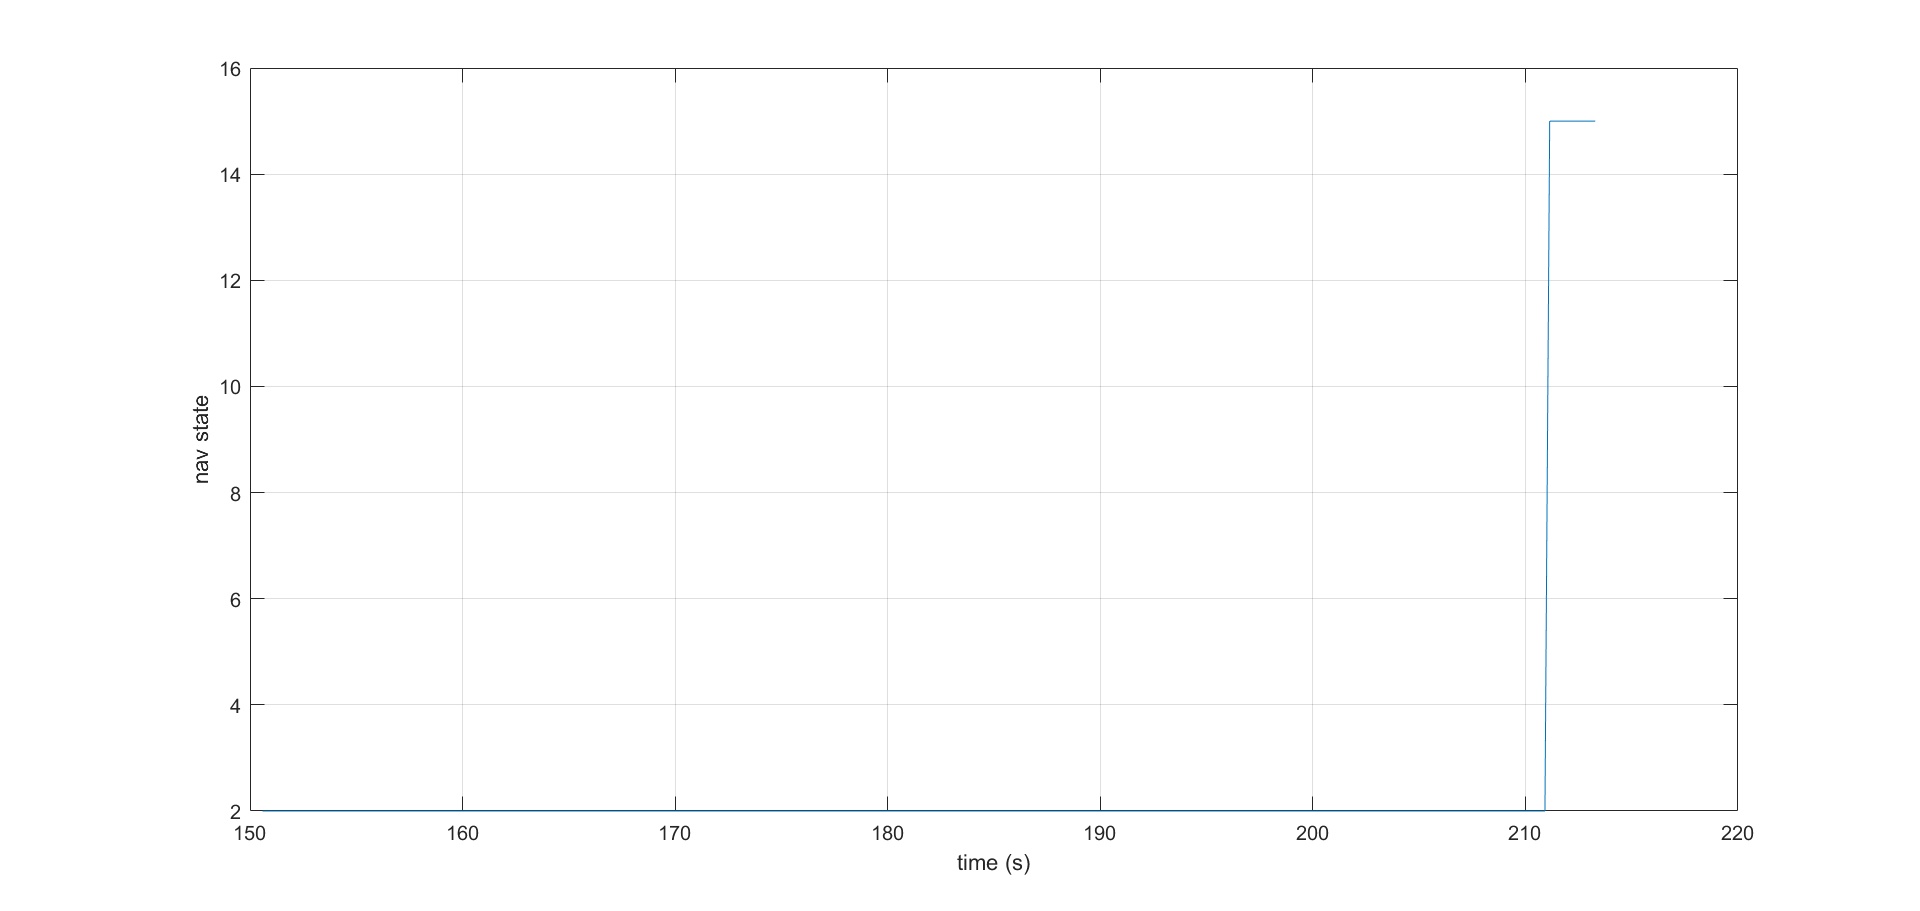
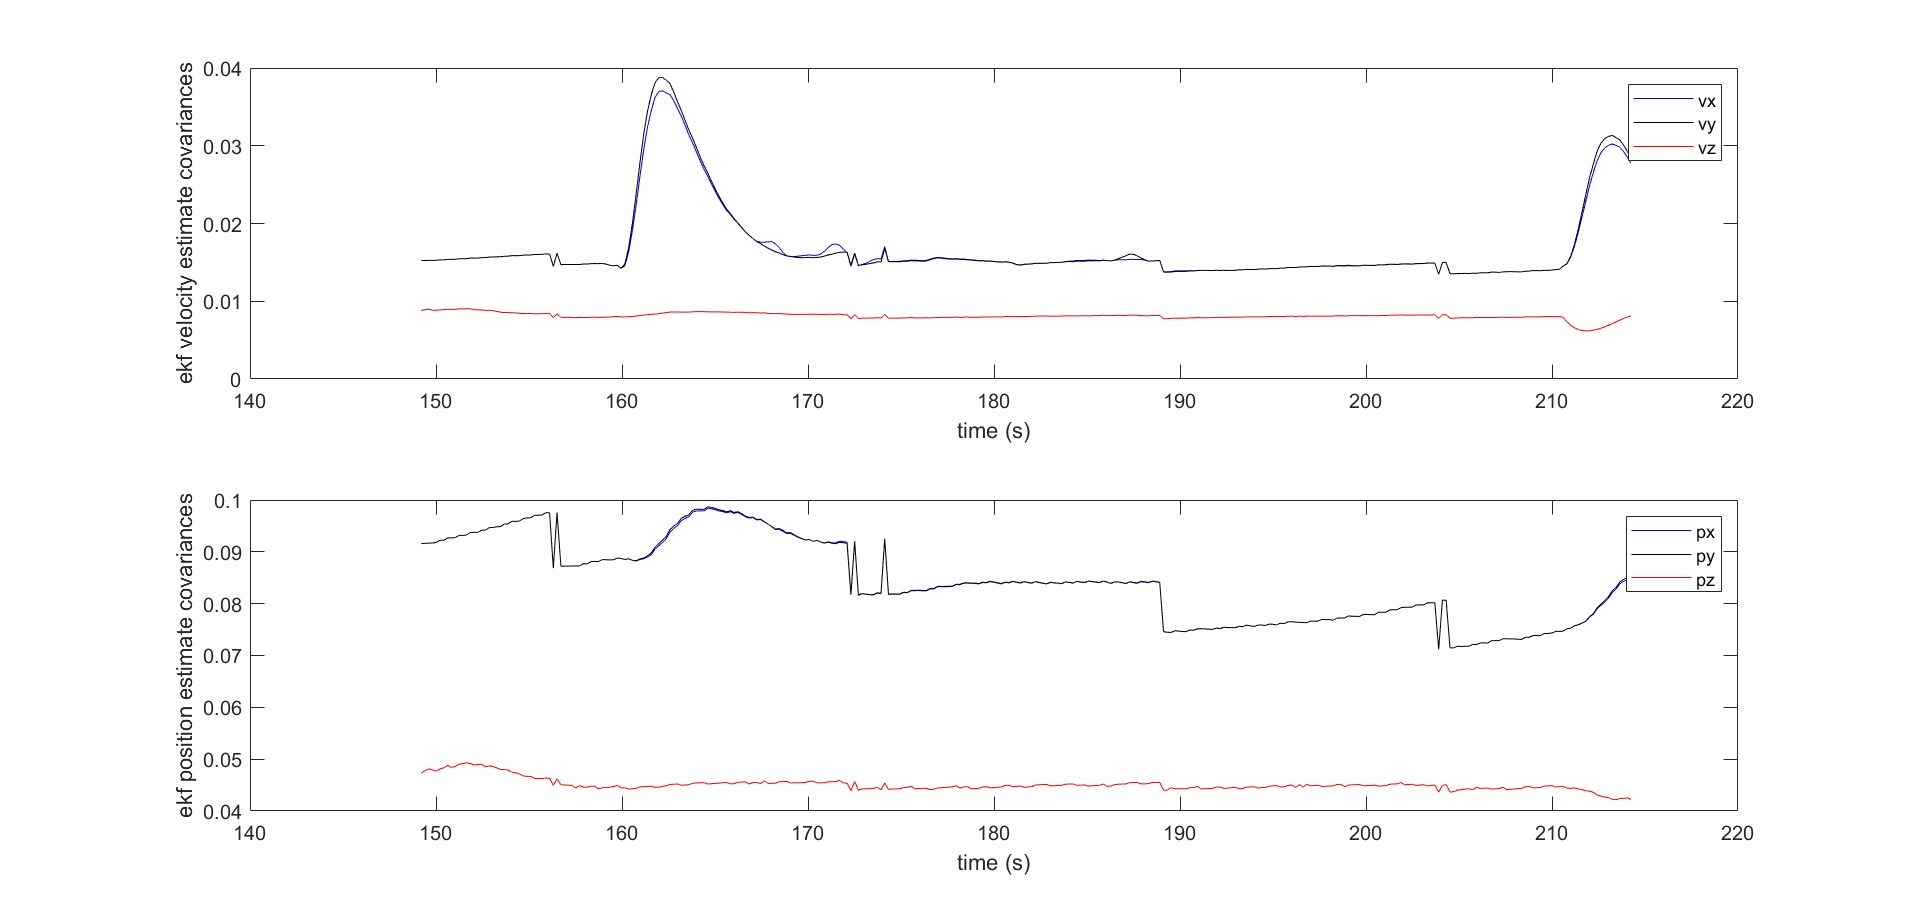
![]() Other figures for battery status, navigation states and EKF estimation covariances are also listed below. They provide quantitative evaluations of power condition, system state and state estimation accuracy, and hence can aid the debugging of abnormal flight behaviors.
Other figures for battery status, navigation states and EKF estimation covariances are also listed below. They provide quantitative evaluations of power condition, system state and state estimation accuracy, and hence can aid the debugging of abnormal flight behaviors.